Australia NSC Employment Shortage Occupations Forecast
The National Skills Commission (NSC) produces in-demand occupation forecasts to provide an indication of where the job market is headed over the next five years. Each year, these forecasts are updated based on emerging trends and developments, using the latest available data, and cover the period up to November 2026. The NSC's employment forecasts consider the net change in employment, which is the net gain or loss in employment over the five-year forecast period. It is important to note that the net change in employment is much lower than the number of jobs over the five-year forecast period. For example, if an employer is recruiting to replace a previous employee who is retiring, this will result in a position being left vacant and filled, but the net gain in employment will be zero.
In fact, even if employment forecasts for an occupation show a decline, or a fall in employment over a particular period, there will still be plenty of jobs available. For example, employment in skill level 5 occupations fell by 117,900 (or 57,100) between February 2020 (before COVID-19) and May 2022 (latest data). According to the National Skills Commission’s (NSC) Internet Jobs Index (IVI) data, there have been nearly 700,000 job advertisements for skill level 5 roles since March 2020.
To quantify the number of opportunities in the labour market for an occupation, the NSC uses data from the Australian Bureau of Statistics' Participation, Job Seeking and Labour Mobility (PJSM) ancillary survey to create occupational replacement rates, which is an estimate of the share of employment in an occupation that will be replaced within a year. It is important to note that because this analysis reflects aggregate movement in and out of an occupation, it does not include employee movement between employers in the same occupation (e.g. a cook leaving one restaurant to work at another).
These estimated replacement rates provide insights into the labor market in several ways, and the following are highlights of the analysis. To interpret the occupational replacement rates presented in this analysis, we assume that there are 1,000 employees in an occupation in a given year. A replacement rate of 25% means that during that year, 250 employees left the occupation and were replaced by other employees, which means there are 250 job openings for job seekers to apply for.
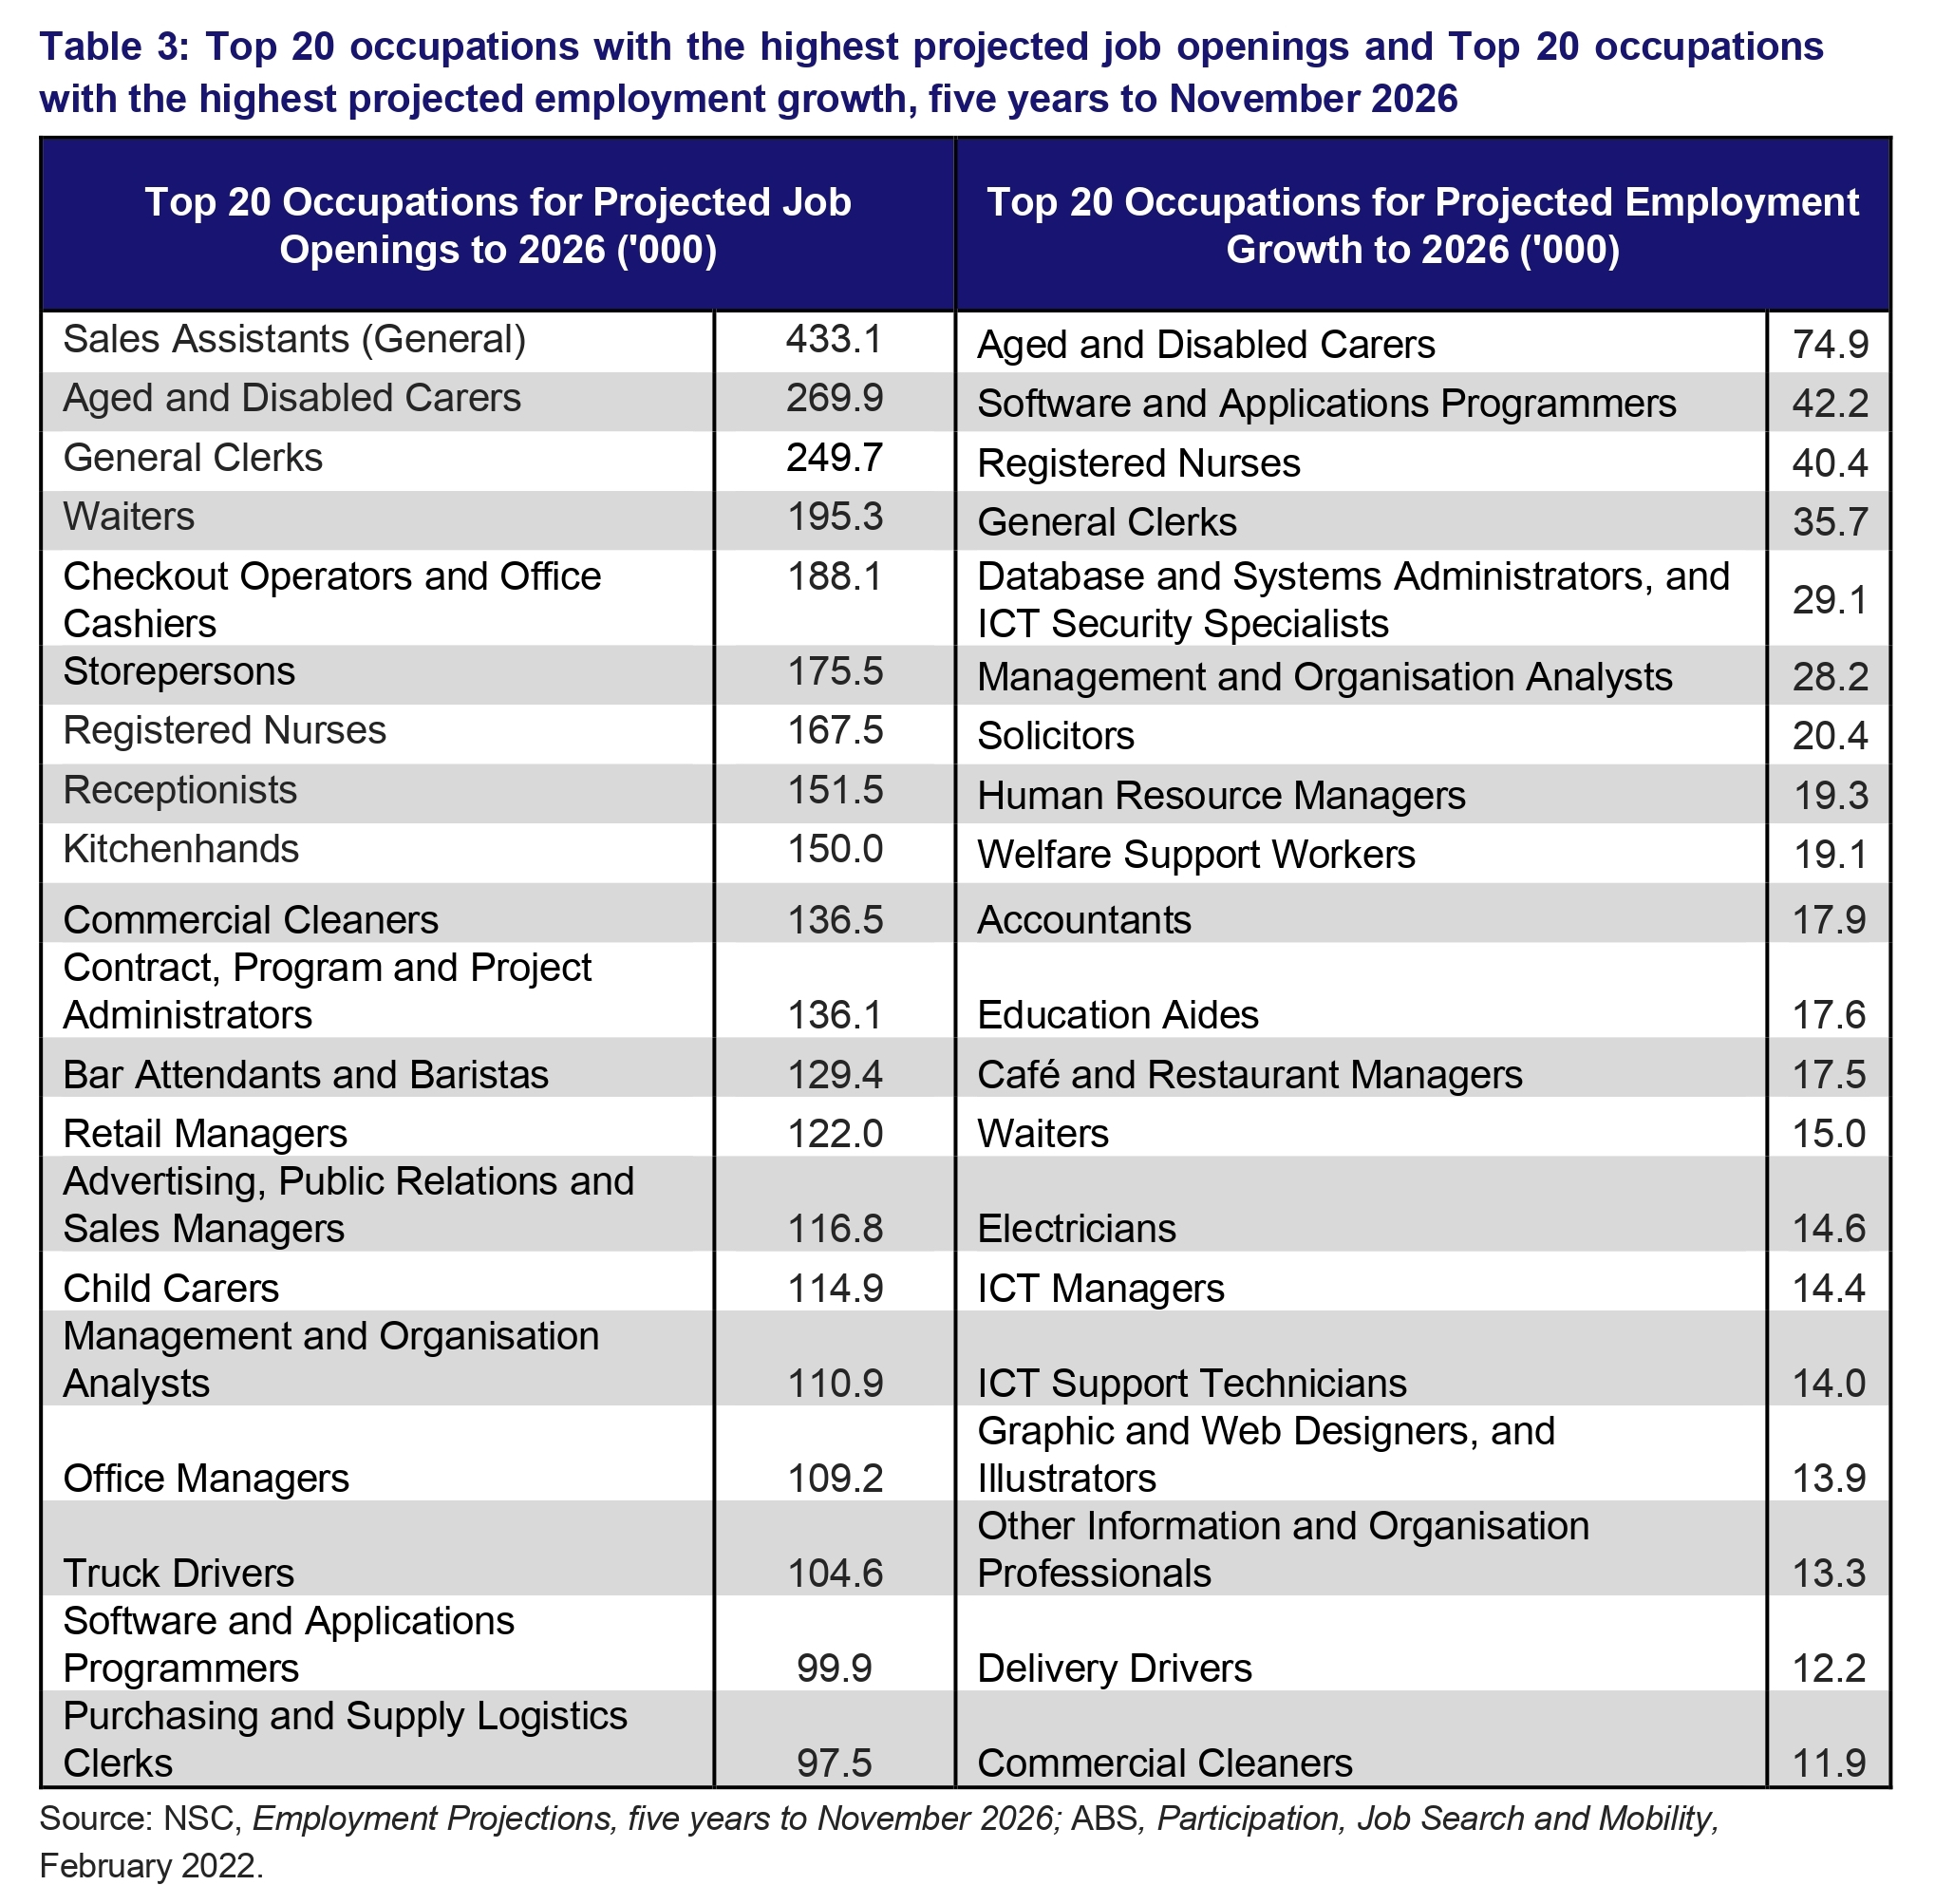
Top 20 occupations with the most job openings
- Sales Assistant (General) 433.1K
- Elderly and disabled caregivers 269.9K
- General clerk 249.7K
- Waiter 195.3K
- Cashier and Office Teller 188.1K
- Warehouse staff 175.5K
- Registered nurse 167.5K
- Front desk receptionist 151.5K
- Kitchen Assistant 150.0K
- Commercial cleaner 136.5K
- Contract, Project and Program Administrators 136.1K
- Bartenders and Baristas 129.4K
- Retail Manager 122.0K
- Advertising, PR and Sales Manager 116.8K
- Child care worker 114.9K
- Management and Organizational Analyst 110.9K
- Office Manager 109.2K
- Truck Driver 104.6K
- Software and Application Programmers 99.9K
- Purchasing and supply logistics clerk 97.5K
Top 20 occupations with the highest employment growth rates
- Elderly and disabled caregivers 74.9K
- Software and Application Programmers 42.2K
- Registered Nurse 40.4K
- General clerk 35.7K
- Database and system administrators, and ICT security specialists 29.1K
- Management and Organizational Analyst 28.2K
- Lawyer 20.4K
- Human Resources Manager 19.3K
- Welfare support workers 19.1K
- Accountant 17.9K
- Education Assistant 17.6K
- Cafe and Restaurant Manager 17.5K
- Waiter 15.0K
- Electrician 14.6K
- ICT Manager 14.4K
- ICT Support Technician 14.0K
- Graphic and web designers, and illustrators 13.9K
- Other information and organization professionals 13.3K
- Delivery Driver 12.2K
- Commercial cleaner 11.9K
For related documents, please refer to the official website https://www.nationalskillscommission.gov.au/
转载请注明:Australian Chinese Encyclopedia AU6001.COM » Official data tells you which occupations will be in short supply in the next three years
